collapse

'23-'24 SOTG Tally


2023-24 Season SoG Tally
Kolek11
Ighodaro6
Jones, K.6
Mitchell2
Jones, S.1
Joplin1

'22-23
'21-22 * '20-21 * '19-20
'18-19 * '17-18 * '16-17
'15-16 * '14-15 * '13-14
'12-13 * '11-12 * '10-11

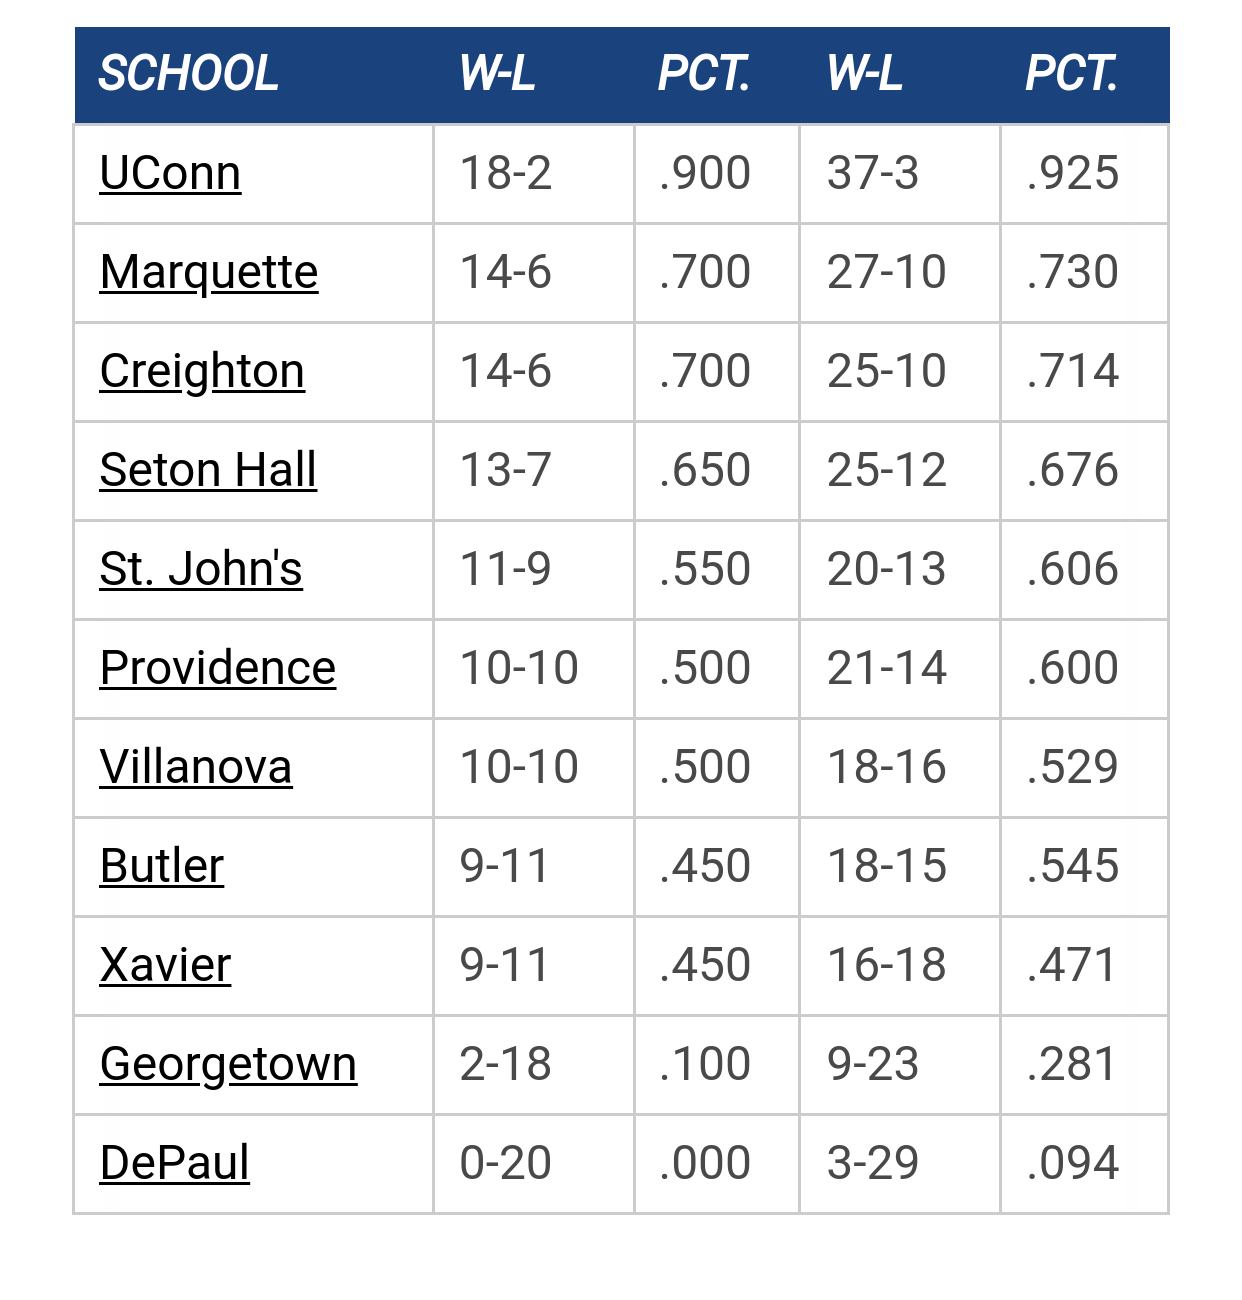
Big East Standings

Recent Posts

Server Upgrade - This is the new server by mileskishnish72
[Today at 07:37:55 PM]


Big East 2024 -25 Results by Uncle Rico
[Today at 06:13:16 PM]


Owens out Monday by TAMU, Knower of Ball
[Today at 03:23:08 PM]


Shaka Preseason Availability by Tyler COLEk
[Today at 03:14:12 PM]


Marquette Picked #3 in Big East Conference Preview by Jay Bee
[Today at 02:04:27 PM]


Get to know Ben Steele by Hidden User
[Today at 12:14:10 PM]


Deleted by TallTitan34
[Today at 09:31:48 AM]

Please Register - It's FREE!

The absolute only thing required for this FREE registration is a valid e-mail address. We keep all your information confidential and will NEVER give or sell it to anyone else.
Login to get rid of this box (and ads) , or register NOW!

Next up: B&G Tip-Off Luncheon

Marquette
Marquette

B&G Luncheon

Date/Time: Oct 31, 2024 11:30am
TV: NA
Schedule for 2023-24
27-10

CrackedSidewalks

Fischer 3rd in Big East "Net Points:" Ellenson near All-American last 6 games after TERRIBLE 1st 4 games

NC State's Cat Barber is averaging 20.6 points per game - but so far Luke Fischer is better. Barber is the only player in a major conference missing more than 11 shots per game (free throws and field goals) while Fischer misses only 4.3 shots per game (a 66.3% field goal percentage for Fischer to below 40% for Barber).

The explanation of "Net Points" (Points minus mistakes) and top 1000 players can be found here, and the more advanced Value Add Ratings are here.

Fischer has 7.5 net points per game (14.3 - 4.3 - 2.5) and Cat has 7.3 (20.6 - 11.1 - 2.2). Once Value Add factors in level of opponents faced, rebounds, steals, assists, defense etc., Fischer's overall Value Add 5.29 and Barber's is 5.08.

As for Henry Ellenson, the last six games he has scored 17.8 points per game with just 7.3 misses per game and 1.3 turnovers which adjusts to 2.0. That would put him in the top 1% of all players with 8.5 net points per game. However, his first four games Ellenson played like a freshman. He scored 14.5 per game, but that was missing 9.5 shots per game and turning the ball over 3.8 times a game (adjusted for 5.7 in the formula) so he actually had a net negative. So it basically took him just until his 5th game to look like an All-American sophomore after four games of looking like a freshman. The future is bright.


PointsMisses Adj TO Net
Ellenson 1st 414.5 9.5 5.7 (0.7)
Ellenson last 617.8 7.3 2.0 8.5

Yet for some reason some critics do not seem to grasp that players who make a lot of mistakes hurt their team - and I constantly get criticism for a player who turns the ball over a lot and hits less than 40% of his shots is not in my top 100 for putting up a lot of positive stats.

The best total in the country is Grayson Allen, Duke's point guard who is averaging 21.4 points per game, minus just 7.3 missed shots per game and 1.7 adjusted turnovers per game. He has totaled 124 "Points minus Mistakes: or 12.4 per game.

The following starts with the top 10 players nationally, then the top 20 Big East players, the top 10 players in the other seven best conferences and finally the 10 best of the rest from other conferences.


RnkNamePosTeamPtsMissesAdj TOPPG-MistPts-MistVA
NAAverage PlayerAllAll6.63.71.61.411.31.3
RnkTop 10 National PlayersPosTeamPtsMissesAdj TOPPG-MistPts-MistVA
1Allen, Grayson 3PGDuke21.47.31.712.412410.5
2Walker, David 4SGNortheastern23.17.13.312.71149.6
3Bradds, Evan 35CBelmont19.44.53.711.21127.7
4Uthoff, Jarrod 20PFIowa19.67.41.510.71079.2
5Robinson, Justin 12PGMonmouth20.47.91.910.61069.2
6Gibbs, Jack 12PGDavidson27.88.72.017.21038.1
7Moody, Stefan 42PGMississippi24.110.93.010.21026.0
8Ware, Gavin 20PFMississippi St.19.04.42.012.71018.8
9Poeltl, Jakob 42CUtah20.16.03.210.9989.9
10Emegano, Obi 15SGOral Roberts25.310.83.710.9986.1
RnkBig East Top 20 PlayersPosTeamPtsMissesAdj TOPPG-MistPts-MistVA
1Dunham, Kellen 24SFButler19.16.72.59.9894.6
2Bentil, Ben 0CProvidence17.78.02.57.2805.4
3Fischer, Luke 40CMarquette14.34.32.57.5755.3
4Smith-Rivera, D'Vauntes 4PGGeorgetown16.27.91.76.6665.7
5Groselle, Geoffrey 41CCreighton10.73.21.26.3635.1
6Chrabascz, Andrew 45PFButler12.34.60.86.9625.8
7Davis, Myles 15PGXavier11.74.61.06.1614.7
8Zierden, Isaiah 21SGCreighton12.05.00.96.1615.8
9Arcidiacono, Ryan 15PGVillanova12.34.61.06.7617.5
10Hart, Josh 3CVillanova15.06.71.86.5597.8
11Martin, Kelan 30CButler14.85.23.26.4574.3
12Henry, Myke 4CDePaul13.23.73.85.7574.1
13Garrett, Billy 5PGDePaul14.26.52.15.6562.8
14Dunn, Kris 3PGProvidence16.88.92.75.2527.8
15Thomas, Khyri 2SGCreighton10.83.52.25.1513.3
16Farr, James 2CXavier10.04.01.14.9495.9
17Ellenson, Henry 13CMarquette16.58.23.44.9493.4
18Bullock, Rodney 5CProvidence13.76.42.94.4494.4
19Bluiett, Trevon 5PFXavier14.67.22.64.8484.9
20Wideman, Tyler 4PFButler10.03.21.55.3475.7
RnkA10 Top 10 PlayersPosTeamPtsMissesAdj TOPPG-MistPts-MistVA
1Allen, Terry 15CRichmond20.68.23.19.3838.7
2Colter, Derrick 1PGDuquesne19.08.22.08.8793.4
3Johnson, Melvin 32SGVCU19.69.41.48.7796.5
4Thomas, Mandell 23SGFordham19.58.31.59.8786.2
5Price, Jordan 21SFLa Salle25.410.14.910.4735.6
6Mason, Micah 22PGDuquesne16.36.71.78.0724.6
7Cavanaugh, Tyler 34CGeorge Washington16.15.83.56.8685.5
8Hinds, Jabarie 5PGMassachusetts16.47.11.97.4676.7
9Cline, TJ 10PGRichmond15.06.21.57.2654.6
10Rhoomes, Ryan 30PFFordham14.13.82.47.9634.4
RnkACC Top 10 PlayersPosTeamPtsMissesAdj TOPPG-MistPts-MistVA
1McClellan, Sheldon 10SFMiami FL16.84.31.810.7967.6
2Gbinije, Michael 0PGSyracuse19.87.62.69.69610.2
3Blossomgame, Jaron 5CClemson16.35.91.78.7876.4
4Jackson, Demetrius 11PGNotre Dame17.86.31.99.5867.6
5Lee, Damion 0SFLouisville18.86.02.210.5848.9
6Beasley, Malik 5SGFlorida St.18.36.12.29.9806.2
7Artis, Jamel 1PGPittsburgh16.34.61.89.8794.8
8Young, Michael 2SGPittsburgh17.64.63.49.6777.0
9Brogdon, Malcolm 15PGVirginia16.97.61.48.0726.9
10Johnson, Brice 11CNorth Carolina13.44.01.57.9717.2
RnkAmerican Top 10 PlayersPosTeamPtsMissesAdj TOPPG-MistPts-MistVA
1Miller, Shonn 32PFConnecticut12.03.80.97.3666.3
2Woodard, James 10SGTulsa16.97.33.26.4644.7
3Gray, Rob 2SGHouston19.68.12.68.8624.5
4Clark, Gary 11CCincinnati9.72.72.05.0556.7
5Cobb, Farad 21SGCincinnati11.75.51.64.6503.3
6Harrison, Shaquille 3SFTulsa18.810.63.25.0504.8
7Pollard, Devonta 24CHouston14.95.72.27.0494.5
8Johnson, Ronnie 3PGHouston12.74.41.46.9484.4
9Tyson, BJ 21CEast Carolina14.26.63.04.6463.0
10Enechionyia, Obi 0PFTemple11.64.81.45.4433.1
RnkBig Ten Top 10 PlayersPosTeamPtsMissesAdj TOPPG-MistPts-MistVA
1Robinson, Duncan 22PFMichigan13.63.11.09.5957.0
2Ferrell, Yogi 11PGIndiana16.86.52.08.3928.5
3King, Joey 24PFMinnesota14.84.61.58.7875.4
4Haas, Isaac 44CPurdue13.54.21.67.8865.9
5Trimble, Melo 2PGMaryland15.85.02.68.2827.9
6LeVert, Caris 23PGMichigan16.97.21.78.0808.1
7White, Andrew 3PFNebraska16.76.43.47.0765.0
8Valentine, Denzel 45SGMichigan St.18.68.13.76.8759.8
9Blackmon, James 1SFIndiana16.06.23.26.6735.4
10Forbes, Bryn 5SGMichigan St.12.74.61.86.3703.0
RnkBig 12 Top 10 PlayersPosTeamPtsMissesAdj TOPPG-MistPts-MistVA
1Hield, Buddy 24SGOklahoma22.18.42.311.4809.6
2Niang, Georges 31PFIowa St.17.46.32.78.4756.0
3Brodziansky, Vladimir 10CTCU14.44.02.57.9715.3
4Selden, Wayne 1SGKansas16.45.42.48.6695.9
5Morris, Monte 11PGIowa St.15.16.11.47.6687.5
6Felix, Javan 3PGTexas11.03.60.96.5655.5
7Gathers, Rico 2CBaylor15.15.41.87.9647.8
8Williams, Devin 41CWest Virginia17.06.04.07.0635.7
9McKay, Jameel 1CIowa St.15.05.92.66.5595.6
10Ellis, Perry 34PFKansas14.86.11.57.1574.7
RnkPac 12 Top 10 PlayersPosTeamPtsMissesAdj TOPPG-MistPts-MistVA
1Scott, Josh 40CColorado18.05.12.010.9878.5
2Andrews, Andrew 12PGWashington21.09.62.19.4848.0
3Welsh, Thomas 40PFUCLA12.84.11.27.5755.0
4Alford, Bryce 20PGUCLA16.98.12.56.4704.3
5Rabb, Ivan 1PFCalifornia12.73.52.66.6666.2
6Loveridge, Jordan 21SFUtah15.05.91.97.2655.0
7Trier, Allonzo 11SGArizona13.24.42.66.2622.8
8King, George 24SFColorado17.36.63.07.7613.1
9Hawkinson, Josh 24CWashington St.16.44.92.88.7616.6
10Anderson, Ryan 12CArizona15.66.42.56.6605.6
RnkPac 12 Top 10 PlayersPosTeamPtsMissesAdj TOPPG-MistPts-MistVA
1Punter, Kevin 0PGTennessee22.98.82.511.6938.3
2Hannahs, Dusty 3SGArkansas18.66.32.010.3923.9
3Bell, Anthlon 5SGArkansas16.97.61.28.2742.7
4Baldwin, Wade 4PGVanderbilt15.35.12.57.7696.2
5Kacinas, Mindaugas 25PFSouth Carolina13.34.21.67.5674.4
6Canty, Kareem 1PGAuburn19.38.31.69.4665.1
7Simmons, Ben 25SFLSU19.07.53.38.26511.3
8Chatkevicius, Laimonas 14CSouth Carolina13.04.91.56.6604.1
9Davis, Tyler 34CTexas A&M11.42.82.75.9596.1
10Kingsley, Moses 33CArkansas15.26.32.56.4586.9
RnkTop 10 Players All Other ConferencesPosTeamPtsMissesAdj TOPPG-MistPts-MistVA
1Felder, Kahlil 20PGOakland24.610.43.410.7967.7
2Daniel, James 11PGHoward29.413.83.711.9956.2
3Beane, Anthony 25SGSouthern Illinois20.58.33.48.9983.4
4Timmer, Reed 12PGDrake19.06.82.69.6863.3
5Balentine, DJ 31PGEvansville21.99.82.79.4852.2
6Adams, Josh 14PGWyoming24.49.43.111.9958.3
7Reischel, Jarelle 30CEastern Kentucky19.36.35.17.9877.2
8Engesser, Nate 33SGDenver15.94.12.19.7974.8
9Evans, Mo 0PGIPFW17.26.72.28.3915.2
10White, Jake 43PFNebraska Omaha16.24.71.99.6874.1

Source: Fischer 3rd in Big East "Net Points:" Ellenson near All-American last 6 games after TERRIBLE 1st 4 games

real chili 83

Interesting that two of our losses come against team with a player in the top 5 nationally. 

Are they that good or did we "help" them with our poor play?   :o

bamamarquettefan

Good point - but with 10 games in even one poor early defensive on our part they would probably be up there anyway - but I will go ba  ck and do the math
The www.valueaddsports.com analysis of basketball, football and baseball players are intended to neither be too hot or too cold - hundreds immerse themselves in studies of stats not of interest to broader fan bases (too hot), while others still insist on pure observation (too cold).

brandx

This is interesting stuff. I don't know how much value it has now with all the cupcakes that we played (and that other top teams played).

But once we are well into conference season where teams know each other and are well scouted, this should give some real insight.

Hopefully, you will give us more info once we are into the BE portion of the schedule.

bamamarquettefan

You make a very good point - the Value Add equations calculate the opposing defense and offense faced in every game (thus MU players are held down just like the team RPI is held down). This is a simple equation that at least identifies ball hogs with high points per game and players like Ellenson who have made huge improvements even though the ppg is not that much higher.
The www.valueaddsports.com analysis of basketball, football and baseball players are intended to neither be too hot or too cold - hundreds immerse themselves in studies of stats not of interest to broader fan bases (too hot), while others still insist on pure observation (too cold).